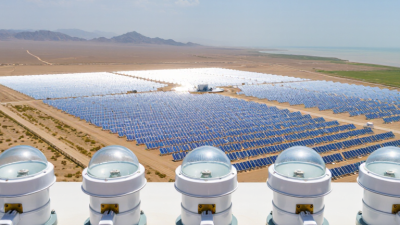








Solar power is expanding quickly, but dependable sunlight data remains the foundation of sound project decisions. IRENA’s Renewable Capacity Statistics 2024 reported approximately 1,419 GW of global solar capacity by the end of 2023. That scale increases the need for accurate, comparable measurements across deserts, rooftops, farms, and coastal sites.
A pyranometer sensor measures global horizontal irradiance, helping engineers evaluate system performance, resource quality, and long-term degradation. The World Meteorological Organization stresses careful calibration, exposure control, maintenance, and uncertainty management in solar radiation observations. Small installation errors matter. A tilted mounting plate, dusty glass dome, or shaded cable can distort valuable readings.
Solar radiation specialist Dr. Frank Vignola has stated, “Good solar resource assessment begins with good measurements.” That principle sounds simple, yet global buyers often overlook it. Price alone cannot reveal thermal offset, spectral response, cosine error, calibration traceability, or field durability. These differences become visible in the field: a sensor may face bright sun, blowing sand, freezing rain, or months without inspection.
This guide compares ten leading pyranometer sensor options for international buyers. It considers accuracy classes, response time, environmental protection, calibration support, data compatibility, and total ownership cost. The selection is not perfectly universal. A research observatory needs different performance from a commercial rooftop. Still, the comparison offers a practical starting point for engineers, procurement teams, and renewable-energy investors seeking reliable solar measurements.
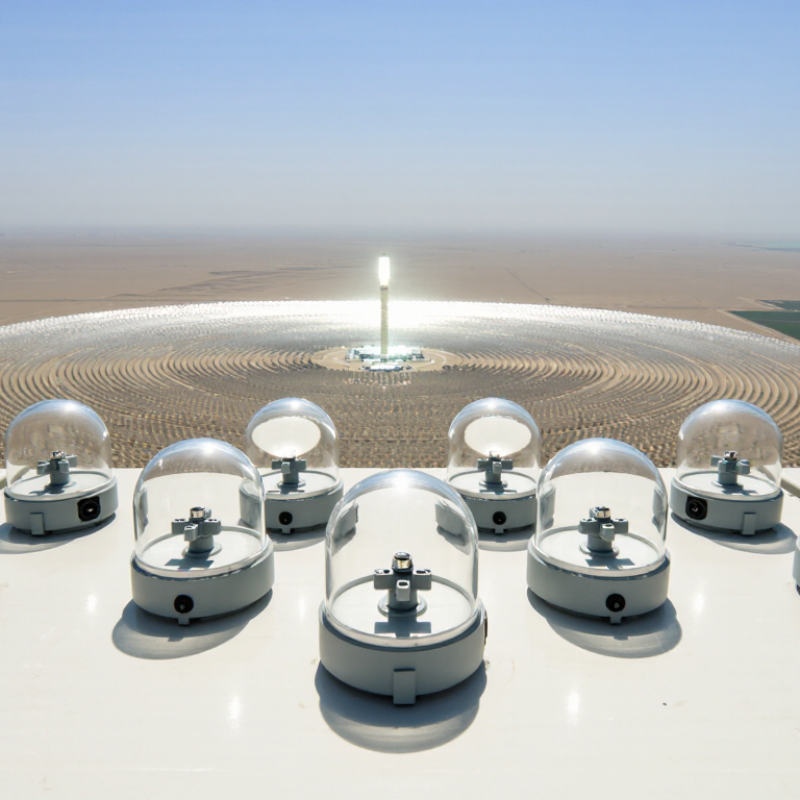
A pyranometer measures solar irradiance, the solar power reaching a surface. Its readings are usually expressed in watts per square meter (W/m²). It sounds simple. Not quite.
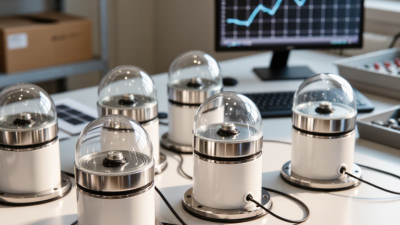
Most research-grade pyranometers use a thermopile beneath a glass dome. Incoming radiation warms the sensing surface, creating a tiny voltage. The instrument converts this signal into irradiance through a calibration factor. The dome helps protect the sensor and supports a broad viewing angle. A quality model also requires stable leveling, clean optics, and a reliable data logger.
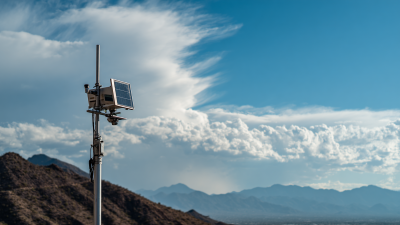
In field testing, installation often affects results more than expected. Nearby walls, poles, or tree branches can cast brief shadows across the sensor. Dust and rain marks may reduce the measured signal. The sensor should face the correct plane and remain level, especially on rooftops with vibration. Temperature compensation can improve accuracy during cold mornings and hot afternoons.
Different technologies suit different tasks. Thermopile sensors provide broad spectral coverage for solar resource assessment. Silicon sensors can respond quickly, but their spectral range is narrower. Buyers should examine response time, cosine response, operating temperature, calibration traceability, and maintenance requirements. A specification sheet may look precise, yet real performance depends on the site. Even careful operators should question unusual readings and compare them with nearby weather data.
Choosing among the top 10 pyranometer sensors requires more than comparing prices. Start with measurement purpose, not marketing claims. ISO 9060:2018 classification helps buyers separate high-quality, secondary-standard instruments from basic devices. Check spectral response, cosine response, thermal stability, and calibration uncertainty. These factors shape readings under cloudy skies, low sun angles, and changing temperatures.
The scale matters. IRENA’s Renewable Capacity Statistics 2024 reported 473 GW of renewable capacity added globally in 2023, including about 346 GW of solar power. This growth increases the need for dependable irradiance data. Compare each sensor’s response time, operating range, ingress protection, connector quality, and data compatibility. A laboratory calibration certificate is useful, but its traceability and calibration date matter more. Field experience also shows that a clean sensor dome can influence results more than a small specification difference.
Tips: Ask for uncertainty data across the full temperature range. Inspect the mounting level, cable routing, and ventilation space. Confirm whether replacement desiccant and recalibration services are available locally. Avoid selecting a sensor only because it has the fastest response time. That can be a weak advantage for slow-changing systems. WMO Guide to Instruments and Methods of Observation No. 8 recommends regular inspection and documented maintenance. Still, maintenance intervals vary with dust, humidity, and site exposure. Buyers should compare real service conditions, not ideal laboratory figures. Some specifications remain unclear. Ask better questions.
Choosing a pyranometer depends on the sunlight, site, and measurement goal. Reference-grade thermopile sensors suit research stations and long-term climate studies. Secondary-standard models support solar resource assessments and bankable energy planning. Spectrally flat thermopile sensors perform well across changing weather. Silicon sensors offer faster response for photovoltaic control, though their spectral range is narrower. Photodiode sensors fit compact monitoring systems with limited budgets.
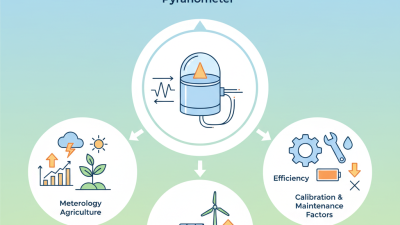
Agricultural installations often benefit from ventilated sensors that reduce dust, dew, and temperature errors. Heated models help in humid, snowy, or coastal regions. For rooftop systems, compact low-power sensors simplify installation near inverters. Wireless pyranometers serve remote weather stations, especially where cable routes are difficult. Calibrated portable sensors assist technicians during commissioning and troubleshooting. Each application needs a different balance of accuracy, response time, durability, and maintenance.
Field experience shows that placement can matter as much as sensor class. A shaded dome or tilted mounting surface can distort an otherwise excellent reading. Follow recognized calibration practices, including ISO 9060 classification, and keep records of cleaning and recalibration. Check the operating temperature, output signal, ingress protection, and data logger compatibility before purchasing. No sensor fits every roof. That assumption fails in dusty deserts and icy mountain sites. Even expensive equipment can produce weak data when leveling, cleaning, or cable shielding is neglected. Buyers should compare documented uncertainty, service support, and calibration traceability rather than relying on price alone.
Top 10 Pyranometer Sensors for Global Buyers
How to Choose the Right Pyranometer for Your Environment
Choosing a pyranometer starts with the site, not the product list. ISO 9060:2018 classifies instruments by response quality, stability, and directional behavior. For utility-scale solar plants, a higher-performance secondary-standard sensor can reduce uncertainty in performance calculations. The IEA PVPS Trends 2024 report states that global photovoltaic capacity exceeded 1.6 terawatts in 2023. That scale makes small measurement errors commercially important. Check the sensor’s spectral range, response time, calibration interval, and operating temperature. A snowy mountain site needs heating or ventilation options. A humid coastal site needs strong sealing and corrosion resistance. Desert installations need careful attention to dust buildup.
Tips: Match the sensor class to your measurement goal. Use a fast-response model for changing cloud conditions. Confirm whether the data logger accepts the output type. A millivolt signal may require different wiring from a digital interface. Also inspect the mounting surface. A tilted sensor can create quiet, persistent bias.
WMO Guide No. 8 recommends regular inspection, cleaning, leveling, and calibration checks for radiation instruments. Field experience supports this advice, although maintenance schedules are often too optimistic. Dust may return within hours after cleaning. In cold climates, frost can distort morning readings before staff notice. Compare the pyranometer with a reference instrument when possible, and record unusual weather beside the data. The cheapest sensor is not always economical. The most advanced one may be unnecessary. That judgment deserves review.
| Rank | Sensor Configuration | Typical ISO 9060 Class | Spectral Response | Typical Measurement Range | Response Time | Typical Field Uncertainty | Recommended Environment | Key Selection Advantage |
|---|---|---|---|---|---|---|---|---|
| 1 | Ventilated reference-grade thermopile | Class A | Approximately 285–3,000 nm | 0–2,000 W/m² | About 1 second or less | About 1–3% annually with proper maintenance | Utility-scale solar farms, meteorological stations, research sites | Highest accuracy and strong long-term stability across the solar spectrum |
| 2 | Heated and ventilated thermopile | Class A | Approximately 285–3,000 nm | 0–2,000 W/m² | About 1–5 seconds, depending on design | About 1–3% annually with correct cleaning and calibration | Cold, humid, snowy, coastal, or dusty climates | Reduces dew, frost, snow, and ventilation-related measurement errors |
| 3 | Precision unventilated thermopile | Class A or Class B | Approximately 285–3,000 nm | 0–2,000 W/m² | About 1–5 seconds | About 2–5% annually in a well-maintained installation | Moderate climates and sites with routine manual cleaning | Good broadband accuracy without the power consumption of active ventilation |
| 4 | Standard thermopile pyranometer | Class B | Approximately 285–3,000 nm | 0–2,000 W/m² | About 5 seconds or less | About 2–5% annually | Commercial solar monitoring and general weather stations | Balanced cost, durability, and broadband solar measurement |
| 5 | Compact Class C thermopile | Class C | Approximately 300–2,800 nm | 0–1,500 W/m² | About 5–15 seconds | About 3–10% annually | Budget-sensitive agricultural, building, and educational systems | Affordable broadband measurement for trend monitoring |
| 6 | Silicon photodiode pyranometer | Usually Class C or non-classified | Approximately 400–1,100 nm | 0–1,500 W/m² | Milliseconds to less than 1 second | About 3–10%, depending on spectral conditions | Fast-response control systems, agriculture, and portable instruments | Very fast response, small size, low power consumption, and simple integration |
| 7 | Calibrated silicon reference-cell sensor | Application-specific; generally not a broadband ISO pyranometer | Approximately 350–1,100 nm | 0–1,500 W/m² | Milliseconds to less than 1 second | About 2–5% for matched photovoltaic technologies | PV performance testing and plane-of-array monitoring | Better spectral similarity to photovoltaic modules than a general broadband sensor |
| 8 | Low-irradiance thermopile sensor | Class A or Class B | Approximately 285–3,000 nm | Approximately 0–1,500 W/m² | About 1–10 seconds | About 2–5% annually, depending on the low-signal electronics | High-latitude locations, winter monitoring, and diffuse-light studies | Improved stability and signal quality when irradiance is weak |
| 9 | Rugged desert-duty thermopile | Class A or Class B | Approximately 285–3,000 nm | 0–2,000 W/m² | About 1–10 seconds | About 2–5% annually with frequent cleaning | Hot, dry, dusty, high-altitude, and high-UV environments | Robust housing and stable operation under thermal and dust stress |
| 10 | Heated snow- and frost-resistant thermopile | Class B or Class A | Approximately 285–3,000 nm | 0–2,000 W/m² | About 1–10 seconds | About 2–5% annually with correct heater operation | Snow belts, alpine regions, cold maritime climates, and winter solar sites | Maintains a clearer optical dome during icing, frost, and snowfall events |
Top 10 Pyranometer Sensors for Global Buyers
Installation, Calibration, and Maintenance Requirements for Buyers
When comparing the top 10 pyranometer sensors, installation details deserve equal attention. Mount the sensor on a rigid, level surface with an unobstructed view of the sky. Avoid nearby walls, exhaust outlets, reflective roofs, and moving shadows. A bubble level helps, but field technicians should still inspect the horizon manually. Cable routes must prevent water entry and electrical noise. Use weatherproof connectors, secure clamps, and a gentle cable loop beneath the enclosure.
Calibration should follow the sensor’s technical class and the project’s measurement risk. Request a current calibration certificate with traceability to a recognized national or international laboratory. Confirm the stated sensitivity, response characteristics, uncertainty, and operating temperature range. A reference comparison can reveal installation errors that paperwork cannot. Keep a written baseline after commissioning. It may look overly cautious.
Maintenance is rarely difficult, but it is easy to postpone. Clean the glass dome with distilled water and a soft, lint-free cloth. Remove dust, bird marks, frost, and salt deposits before they distort daily readings. Inspect desiccant indicators, seals, cables, and mounting screws during scheduled site visits. In harsh coastal or desert locations, monthly checks may be sensible. Other sites may require quarterly inspections. That assumption can fail.
Buyers should also examine heating, ventilation, leveling hardware, data compatibility, spare parts, and service access. Compare uncertainty under real weather conditions, not only laboratory values. Record every cleaning, recalibration, replacement, and abnormal reading. A sensor that survives the brochure may still struggle on a vibrating rooftop.
Buyer planning benchmark for installation checks, cleaning frequency, and calibration intervals. Actual schedules should be adjusted to local dust, salt, snow, rainfall, pollution, and project quality requirements.
Installation checks include leveling, horizon clearance, cable protection, and verification of the mounting surface. Thermopile pyranometers commonly require periodic calibration against a traceable reference, while frequent cleaning is essential in dusty, coastal, industrial, and agricultural environments.